Debug a Lens With the JavaScript Debugger
Attach VS Code or Cursor to a Lens running in the Lens Studio Preview or on SPECS to set breakpoints, step through scripts, and inspect variables, or let CLAD drive the debugger.
- Available on all platforms
From a compatible code editor you can set breakpoints in your Lens scripts, step through them line by line, and inspect the call stack and variables, in a Lens Studio Preview panel or on SPECS.
CLAD can drive the debugger for you: name the /lens-js-debugger skill in a prompt, or ask the
assistant to use the debugger. See CLAD Agents and Skills for the other
skills.
Where you can attach the JavaScript debugger
You can attach a debugger to:
- A Lens running on SPECS.
- A Lens Studio Preview panel set to SPECS 27, No Simulation, or Horizontal.
From these code editors:
- VS Code
- Cursor
- Other editors based on VS Code
IntelliJ IDEA and WebStorm can attach to a Preview panel too; see External Debugger.
Attach the debugger to a running Lens
Lens Studio writes the debug configuration, Attach to running Lens (Lens Studio), into the
project's .vscode/launch.json. It connects to Lens Studio on port 9222.
-
Open the same project in Lens Studio and in VS Code.
-
In VS Code, open the Run and Debug view.

-
Start Attach to running Lens (Lens Studio).

-
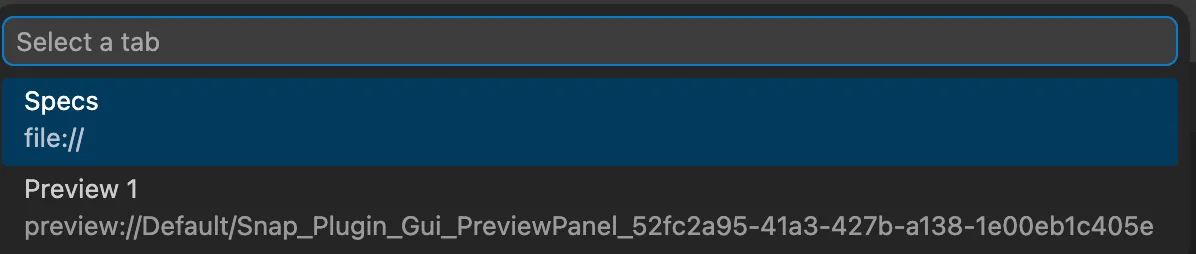
Choose the Lens to attach to from the list: SPECS, or a Preview panel. With only one running Lens, the debugger attaches to it without asking.
-
Debug as you would any JavaScript: pause on breakpoints, explore the call stack, and watch variables.

Debug a Lens on SPECS
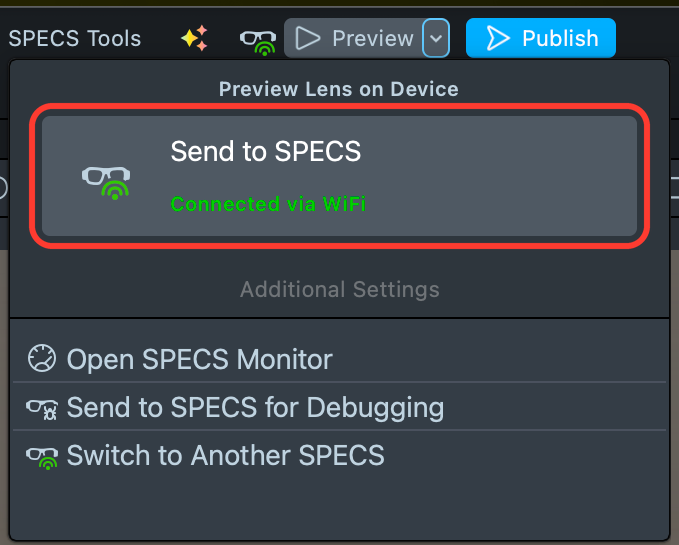
To debug on SPECS, send the Lens with Send to SPECS for Debugging: select Preview Lens in the toolbar, then Send to SPECS for Debugging under Additional Settings. The regular Send to SPECS sends optimized bytecode instead of JavaScript, which has no debug information.
On SPECS:
- You can't reload the Lens and keep the debug session, so catching breakpoints in
onAwakeor in top-level code (see the next section) works only in a Preview panel. - When you're paused in the debugger, expanding the large Global scope and switching often between stack frames can, rarely, drop the connection between Lens Studio and SPECS.
More debugging features are planned for future versions of Lens Studio and Snap OS.
Hit breakpoints in onAwake and top-level code
The debugger attaches to a Lens that is already running, so breakpoints in onAwake or in
top-level script code aren't hit on the first run. In a Preview panel:
- Attach to the running Lens with Attach to running Lens (Lens Studio).
- Set your breakpoints.
- Reload the Lens, keeping the debugger attached.
The JavaScript engine reruns every script from the beginning and stops at your breakpoints.
Things to know about the JavaScript debugger
- The JavaScript engine can't step over an
awaitstatement. Set a breakpoint on the next line and resume instead. - The debugger opens only JavaScript sources in the project's
Assetsfolder. To debug code in a package, unpack the package for editing first. - The Stop Preview button on a Preview panel's toolbar is not a debugger pause.
- Switching to another workspace in Lens Studio ends the debug sessions of all current Preview panels.
- If VS Code shows the list of Lenses and you click elsewhere, the list closes and the debugger attaches to all of them at once. This is VS Code behavior, with no workaround.
- Only one Lens Studio window at a time can host the debugger. A second instance can't start the debug server, because the first one is using its port.
Related
- External Debugger: IntelliJ IDEA and WebStorm, and debugging in the Preview on every platform.
- CLAD Agents and Skills: the
/lens-js-debuggerskill. - Send a Lens to SPECS: the other ways to send a Lens.