SPECS Monitor
Measure the power use and temperatures of a Lens running on SPECS, see when SPECS throttle it, and record and view Perfetto traces, with the SPECS Monitor in Lens Studio.
The SPECS Monitor shows how much power your Lens uses and how warm SPECS get while it runs, so you can find where to improve its performance. For what to do with the numbers, see Optimizing Lens Performance.
Open the SPECS Monitor
- Connect SPECS to Lens Studio.
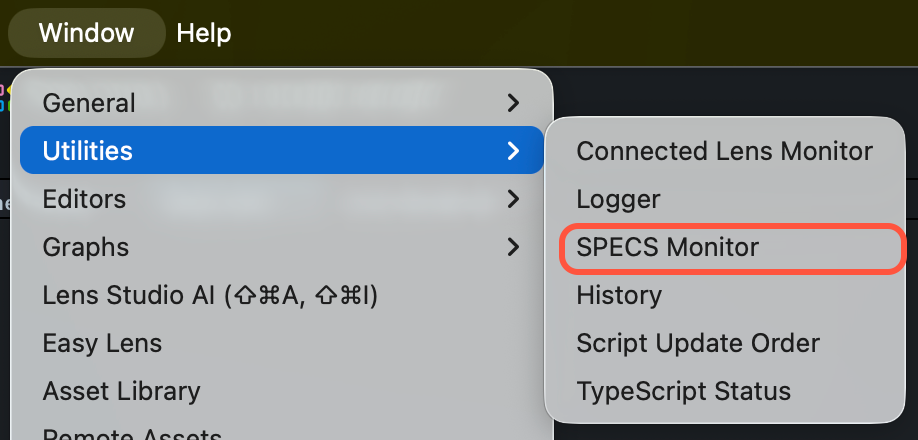
- Select Window > Utilities > SPECS Monitor.
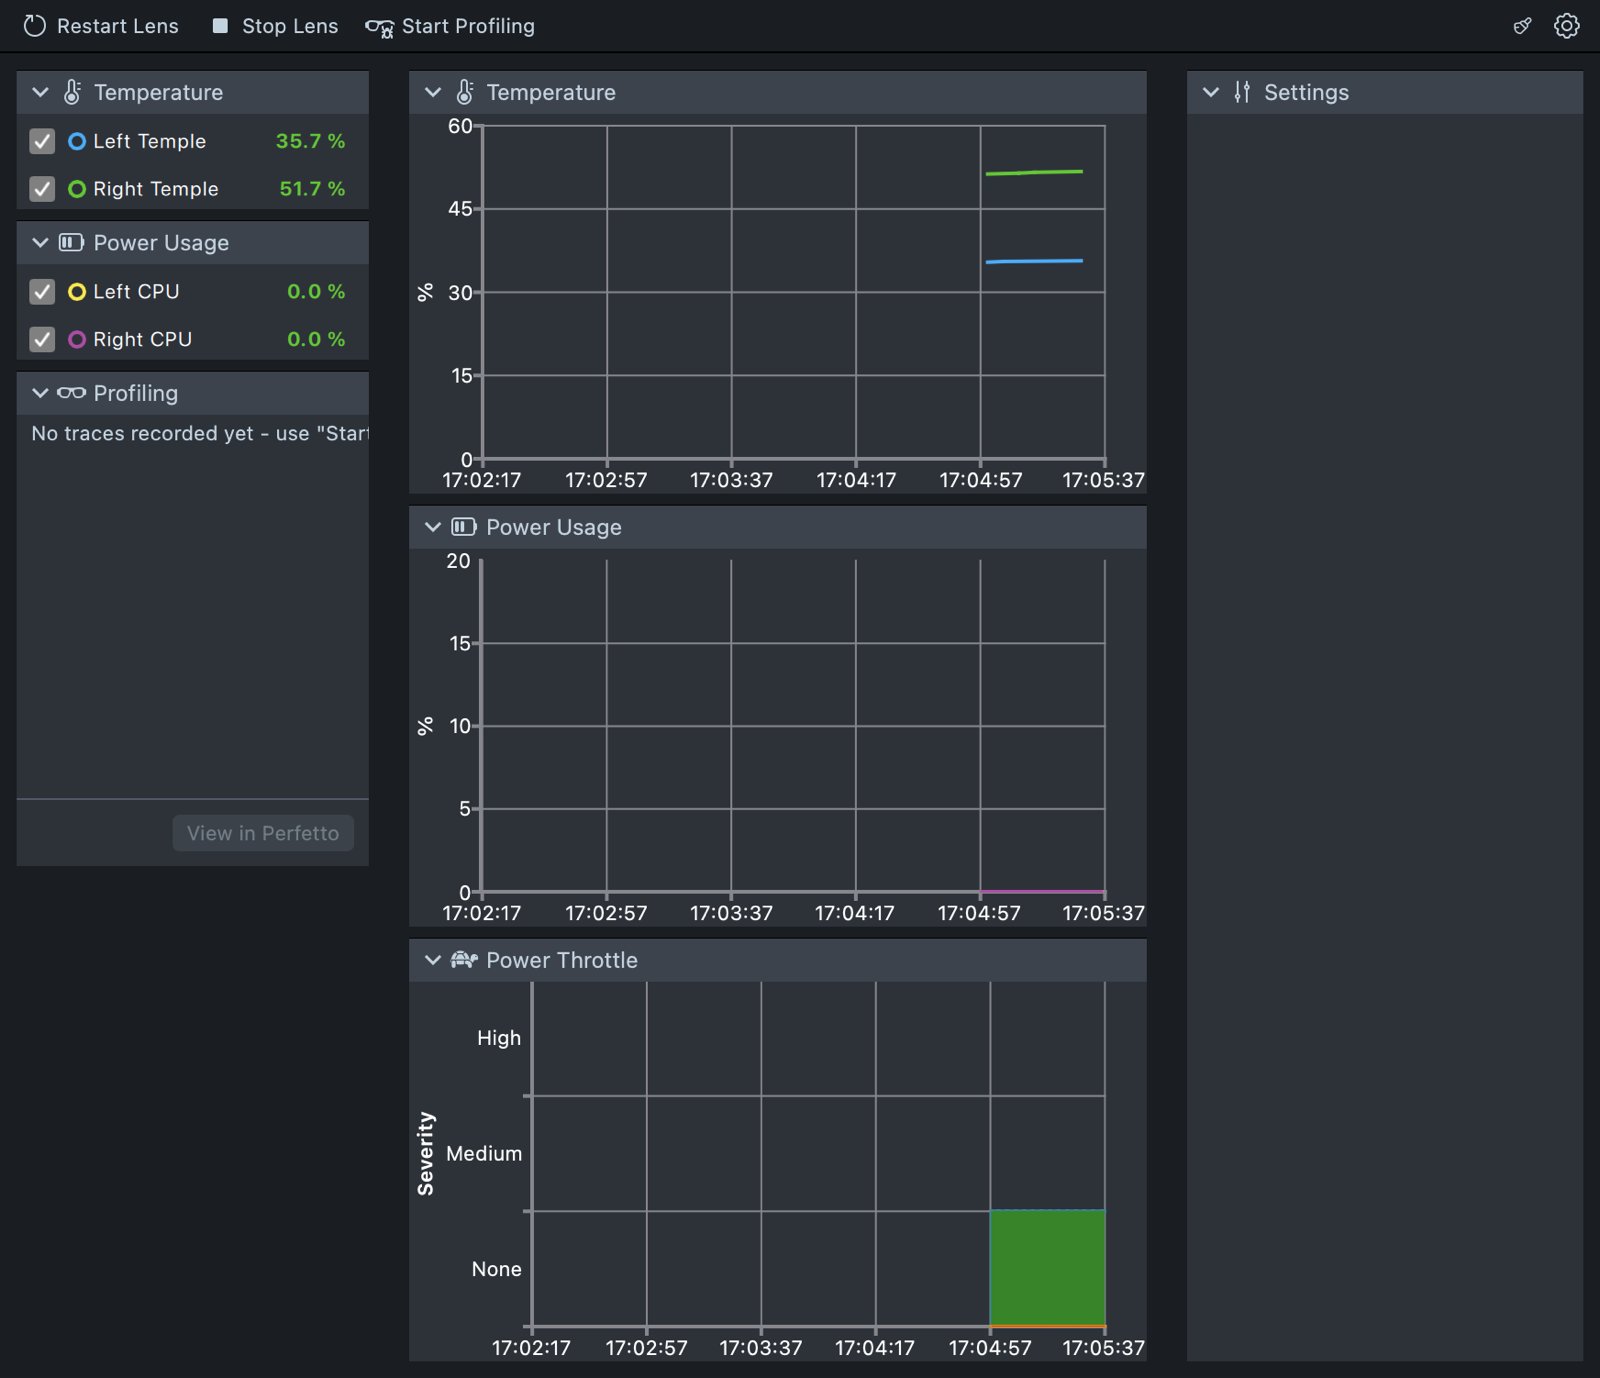
The monitor's toolbar holds Restart Lens, Stop Lens, and Start Profiling. Below it, the monitor shows Temperature, Power Usage, Power Throttle, Profiling, and Settings. Select a section's header to open or close it.
If the graphs stay empty, open Settings and select Sync with SPECS. Lens Studio doesn't pick up changes made on the device on its own.
Measure the power use and temperatures of a SPECS Lens
Once SPECS are connected, the monitor graphs their temperatures and power use over time, each as a percentage. The list on the left shows each series' current value; clear a series' checkbox to hide its line on the graph.
- Temperature shows Left Temple and Right Temple.
- Power Usage shows Left CPU and Right CPU.
To see your Lens's impact, send it to SPECS and watch how Power Usage and the Left Temple and Right Temple temperatures change while it runs, compared with SPECS without it.
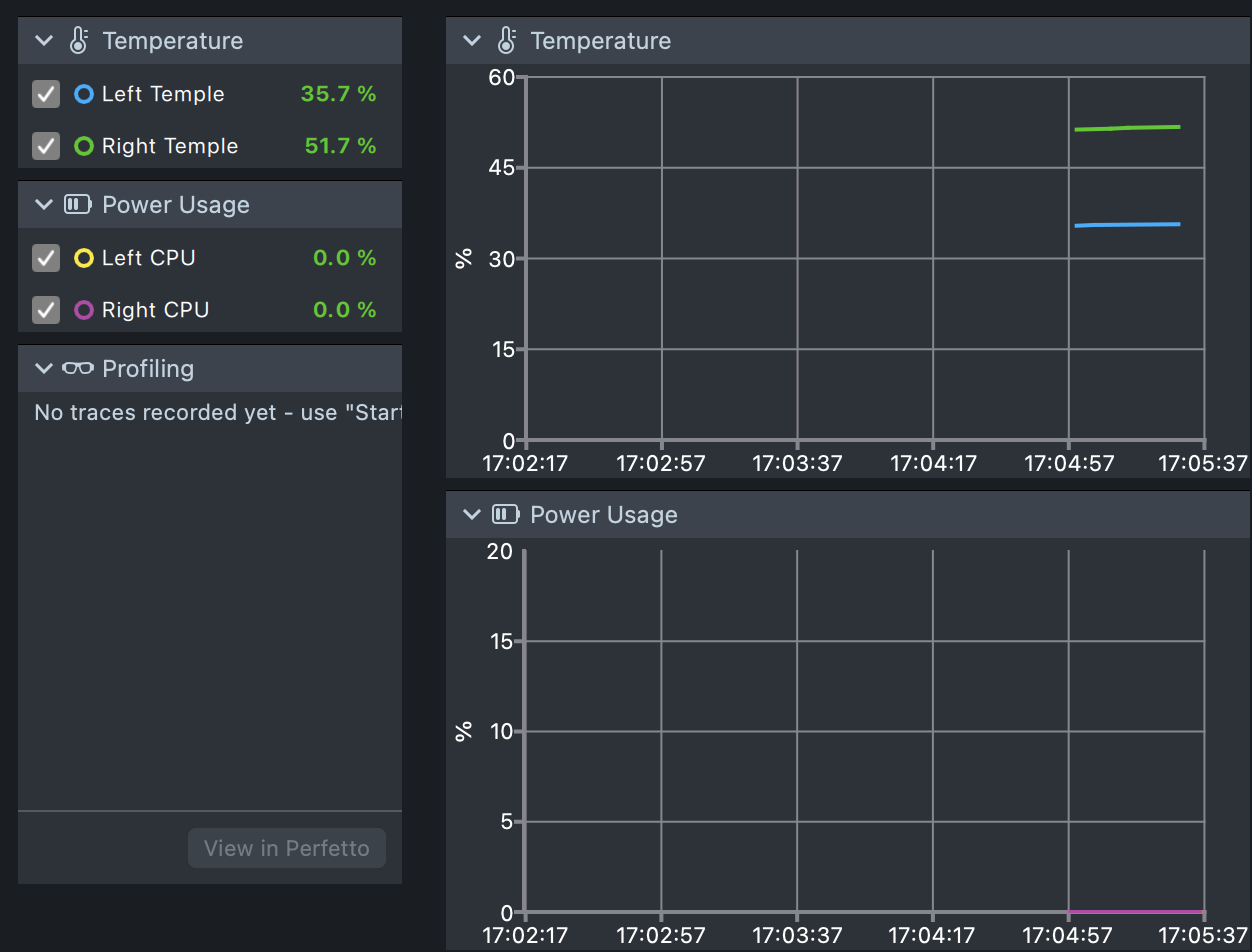
To study a trend, pause the graphs, then drag across a graph to see the average temperature or power over the time you select.
To clear the graphs, select the broom button at the top right of the monitor (Clear History).
See when SPECS throttle a Lens
When a Lens uses too much power or SPECS get too warm, SPECS throttle the Lens: they lower its frame rate and rendering quality. Power Throttle graphs how hard SPECS throttle while your Lens runs, from None through Medium to High. A Lens that SPECS throttle needs optimizing; see Optimizing Lens Performance. To see whether SPECS are limiting your Lens's frame rate, see Device Power Management.
Restart or stop the Lens from the SPECS Monitor
- To run the Lens on SPECS again from its start, select Restart Lens.
- To close the Lens on SPECS, select Stop Lens.
Show the Lens Performance Overlay on SPECS
In Settings, turn on Enable Lens Overlay to show the Lens Performance Overlay over your Lens. No Lens restart needed.
Record a Perfetto trace of a SPECS Lens
Perfetto is an open-source set of performance tracing and visualization tools that works with SPECS. It records system and Lens events and shows them on a timeline, to find performance bottlenecks and debug complex issues.
- Send your Lens to SPECS, so it's running on the device. The monitor can't start profiling before the Lens launches. See Connect Lens Studio to SPECS.
- In the SPECS Monitor, select Start Profiling.
- To end the trace, select Stop Profiling.
The trace appears in the monitor's Profiling list, which reads "No traces recorded yet" until you record one.
View and export Perfetto traces of a SPECS Lens
The Profiling list keeps the traces you record.
- To open a trace, select View in Perfetto. The trace opens in the Perfetto UI, which Lens Studio runs on your computer, on macOS and Windows.
- To save traces to a folder on your computer, export them from the list.
To learn to navigate Perfetto, see the Perfetto documentation.
Related
- Optimizing Lens Performance: what to change when the numbers are high.
- Lens Performance Overlay: read performance on the device.
- Connect Lens Studio to SPECS: connect the device the monitor reads.