Device Power Management
Learn how SPECS limit power as they warm up, how that caps your Lens's frame rate, and how to simulate and monitor throttling in Lens Studio.
SPECS are worn against the skin, so they limit their own power use as they warm up. A Lens that draws a lot of power can have its frame rate capped. Test your Lens under throttling before you publish it.
How SPECS manage power and temperature
The SnapOS Dynamic Power Manager watches the temperature of the right temple and the right battery. As SPECS warm up, it moves through three throttle modes, each with a lower power budget:
| Mode | Meaning |
|---|---|
| None | SPECS aren't limiting power. |
| Medium | SPECS are warm and limit power to a reduced budget. |
| High | SPECS are hot and limit power to the lowest budget. |
Throttling delays a thermal standby or shutdown. It doesn't replace them: if SPECS keep heating, the device still standbys to protect the wearer.
How throttling affects your Lens
- Frame rate cap. In Medium and High mode, if power stays above the budget, SPECS cap your Lens at 90 ÷ frame factor frames per second. The first cap is a frame factor of 3, which is 30 FPS. The factor goes up while power stays high and comes back down as power drops. In Medium or High mode, a Lens that stays within the budget isn't capped.
- Foreground only. The cap applies while your Lens is in the foreground. It resets when your Lens closes or another Lens launches.
- Capture. While the wearer captures video, the cap can't rise above its value when the capture started. It lifts when the capture ends.
- Network. When SPECS are hot, the Wi-Fi channel width narrows to 40 MHz in Medium mode and 20 MHz in High mode, so network throughput can drop.
To stay under the budget, see Optimizing Lens Performance.
React to throttling in your Lens
Subscribe to SnapOS.onThrottleStateChanged to reduce your
Lens's workload while SPECS are throttling. The event fires whenever the throttle state changes and
passes a ThrottleState. If SPECS are already throttling when you subscribe,
it fires once with the current state.
| Property | Type | Description |
|---|---|---|
mode | ThrottleMode | ThrottleMode.None, ThrottleMode.Medium, or ThrottleMode.High. |
frameFactor | number | 0 when your Lens isn't capped. Otherwise 3 or more: your frame rate is 90 ÷ the value. |
@component
export class ThrottleAware extends BaseScriptComponent {
  @input optionalEffects: SceneObject;

  onAwake() {
    SnapOS.onThrottleStateChanged.add((state) => {
      // Turn off optional effects while SPECS are capping the frame rate.
      this.optionalEffects.enabled = state.frameFactor === 0;
    });
  }
}
Check frameFactor, not only mode: in Medium or High mode your Lens isn't capped while it stays
within the power budget.
Simulate throttling in Lens Studio
Test how your Lens behaves in each mode without waiting for SPECS to warm up. The request changes the throttle state your Lens sees in the Preview. It doesn't change the throttle state of SPECS, so a Lens running on SPECS and the SPECS Monitor don't react to it. In the Preview panel:
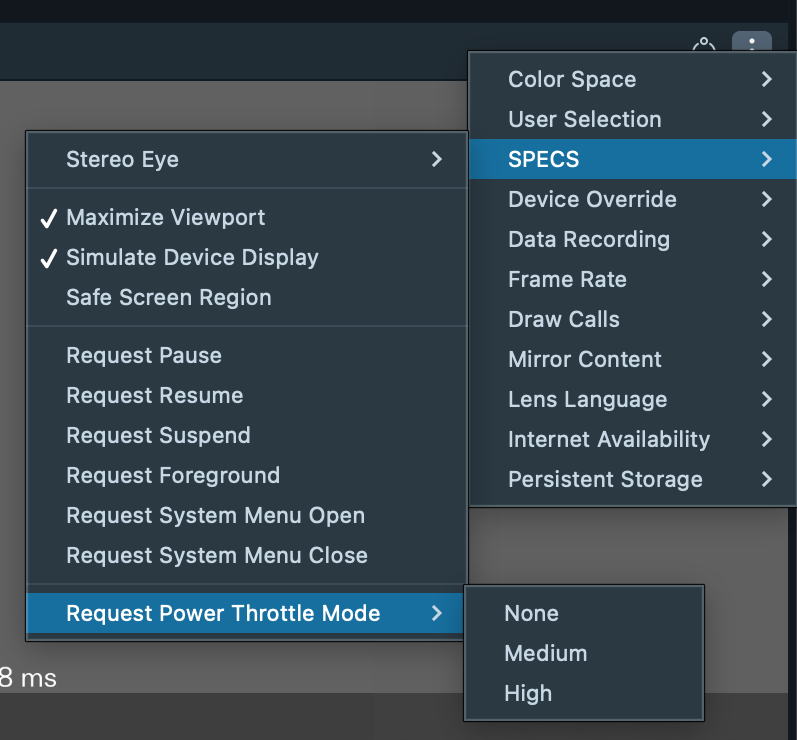
- Select the menu (three vertical dots) at the top right of the panel, then SPECS > Request Power Throttle Mode.
- Select None, Medium, or High.
Your Lens receives one SnapOS.onThrottleStateChanged event
right away, with these values:
| Request | mode | frameFactor |
|---|---|---|
| None | ThrottleMode.None | 0 |
| Medium | ThrottleMode.Medium | 3 |
| High | ThrottleMode.High | 6 |
The simulated frame factors are fixed. On SPECS, the frame factor depends on how far your Lens is over its power budget.
Monitor the throttle state
While SPECS are connected to Lens Studio, the Power Throttle graph in the SPECS Monitor shows the throttle mode of SPECS over time, next to power use and temperatures. The Severity axis runs from None through Medium to High. The graph shows the mode, not the frame factor, and it follows SPECS: requests from the Preview menu don't change it.
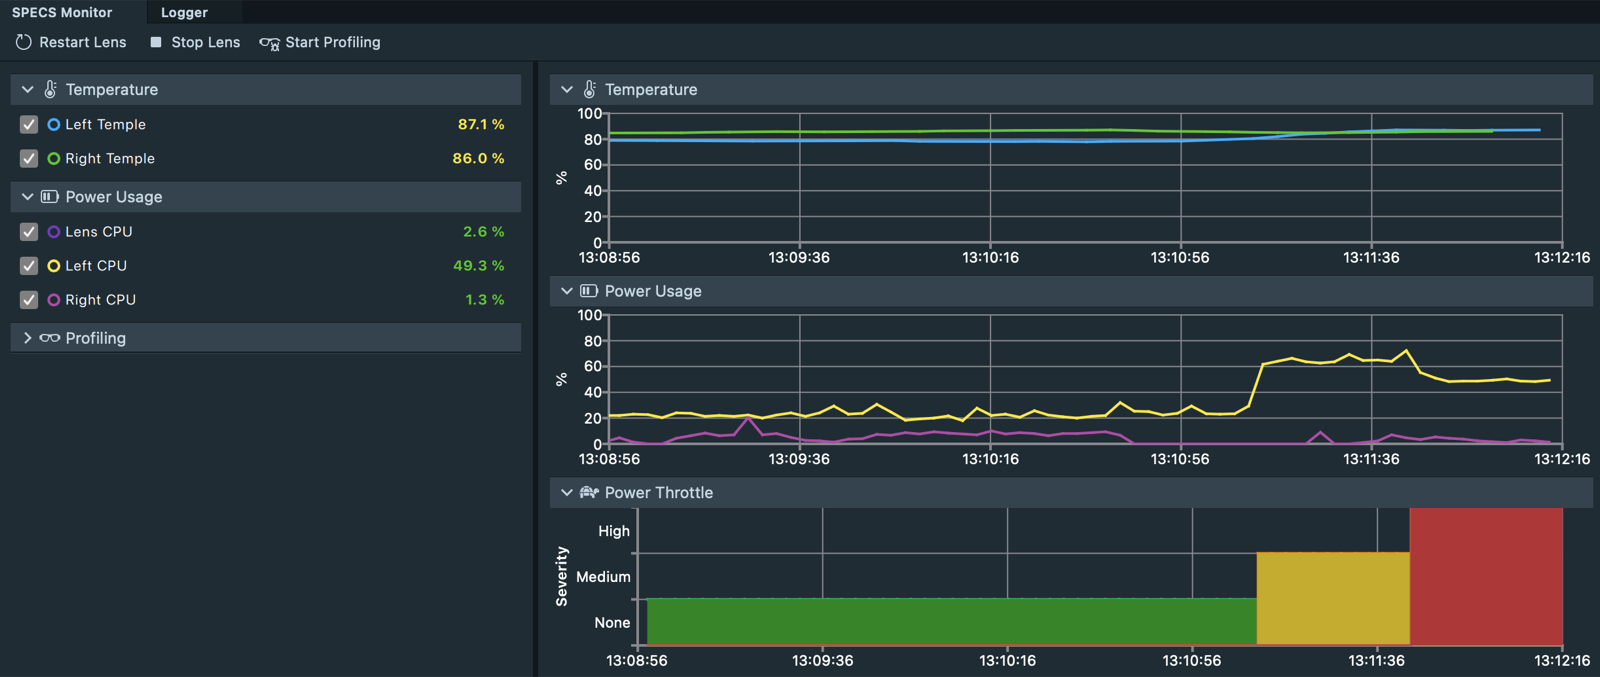
The current state is also written to the Lens Studio log file. The Logger panel doesn't show it.
SPECS send a telemetry line about every 3 seconds, and Lens Studio logs it as a debug entry that
starts with SPECS Telemetry:. The line includes app::dpm_thermal_mode (0 for None, 1 for
Medium, 2 for High) and app::dpm_frame_factor. On macOS, Lens Studio writes one log file for
each launch to ~/Library/Preferences/Snap/Lens Studio/logs, named
LensStudioLog-<date and time>-<id>.txt. On Windows, the folder is
%localappdata%\Snap\Lens Studio\logs. To find the log for the current session on macOS, select
Help > Show Log File in Finder.