Lens Performance Overlay
Read your SPECS Lens's frame rate, CPU and GPU use, memory, power, temperature, and throttling in real time, on the SPECS display, with the Performance HUD.
The Lens Performance Overlay, the Performance HUD, shows your Lens's performance data in real time on the SPECS display, so you can see how efficiently a draft Lens runs while you use it. The SPECS Monitor in Lens Studio shows similar data on your computer.
The overlay uses some power itself. For the most precise power readings in the SPECS Monitor, turn the overlay off while you read them.
Turn on the Performance HUD on SPECS
The Performance HUD needs a special configuration on your SPECS. Your SPECS partner can set it up for you. Then turn it on with Enable Lens Overlay in the SPECS Monitor.
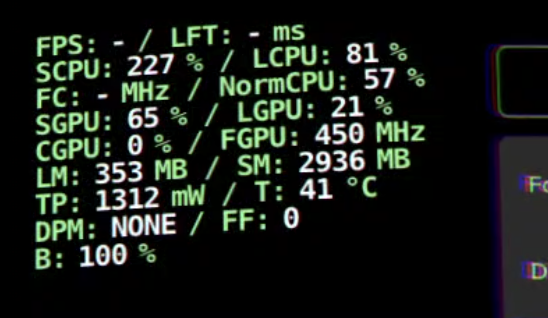
Performance HUD metrics
| Label | Metric | Units | What it measures |
|---|---|---|---|
| FPS | Lens FPS | Frames per second | The frame rate the compositor measures for the Lens. Recommended: 45 FPS. |
| LFT | Lens Frame Time | Milliseconds | The time from the compositor's frame request to the Lens's frame submission. |
| SCPU | System CPU | 0–400% | The whole system's CPU use. 100% is one core fully used; 400% is all four cores. |
| LCPU | Lens CPU | 0–400% | The Lens's CPU use, on the same scale. |
| FC | CPU Frequency | The current frequency of the CPU. | |
| NormCPU | Frequency-Normalized CPU | 0–100% | The whole system's CPU use, normalized for CPU frequency. 100% is every core fully used at the highest frequency. |
| SGPU | System GPU | 0–100% | The whole system's GPU use. |
| LGPU | Lens GPU | 0–100% | The Lens's GPU use. |
| CGPU | Compositor GPU | 0–100% | The compositor's GPU use. |
| FGPU | GPU Frequency | The current frequency of the GPU. | |
| LM | Lens Memory | 0–4,000 MB | The memory the Lens uses. |
| SM | System Memory | 0–4,000 MB | The memory the whole system uses. |
| TP | Total SoC Power | 0–2,000 mW | The power the whole system draws. Recommended: 1,250–1,350 mW. |
| T | Temperature | °C | The temperature at the right temple. |
| DPM | Dynamic power manager mode | NONE, MED, HIGH | The mode of the dynamic power manager, which throttles a Lens that uses too much power. |
| FF | Frame factor | 0–6 | The frame-rate limit the dynamic power manager sets: FPS = 90 / FF. |
| B | Battery | 0–100% | The battery level. |
Keep your Lens within these limits:
- LCPU below 400%.
- LGPU and CGPU below 100%.
- LM below 4,000 MB.
Read the frame rate and frame time
FPS measures how many frames per second SPECS render for your Lens. For your Lens to feel smooth, it should run close to 45 FPS, which leaves about 22 ms for each frame (1,000 ms ÷ 45). LFT shows how long each frame takes.
A frame rate below 45 FPS shows that your Lens is over budget and needs optimizing. This usually happens when the Lens uses too much CPU, GPU, or memory, or when complex rendering takes too long to finish each frame.
Reduce high Lens CPU use
LCPU shows how much of the CPU your Lens uses. High CPU use affects the whole device's performance and battery life.
Common causes of high CPU use:
- Complex scripts with heavy computation
- Instantiating or destroying objects often
- Inefficient loops or calculations
- Machine learning model inference
To reduce it:
- Make scripts simpler, and update them less often.
- Pool objects instead of instantiating them often.
- Cache calculations where you can.
- Optimize ML models, or make them simpler.
Reduce high Lens GPU use
LGPU shows how much of the GPU your Lens uses to render. High GPU use usually means rendering that needs optimizing.
Common causes of high GPU use:
- Complex materials and shaders
- Meshes with many polygons
- Several VFX or screen overlays
- High-resolution textures
- Overdraw from overlapping transparent objects, particle effects, and materials
To reduce it:
- Make materials and shaders simpler.
- Use meshes with fewer polygons.
- Use fewer VFX and screen overlays, or combine them.
- Compress textures and lower their resolution.
- Use fewer overlapping transparent objects and particle effects.
Reduce high Lens memory use
LM shows how much memory your Lens uses on SPECS. Too much memory use degrades performance and can crash the Lens.
Common causes of high memory use:
- Large textures and assets
- Memory leaks in scripts
- Unused objects kept in memory
To reduce it:
- Use compressed textures, and make assets smaller.
- Clean up unused objects in your scripts regularly.
- Profile memory use to find and fix leaks.
Watch power, temperature, and throttling
Each Lens runs within a power budget. TP shows the power the whole system draws, and T the temperature. When a Lens draws too much power or SPECS get too warm, the dynamic power manager throttles the Lens: DPM shows its mode, and FF the frame-rate limit it sets.
- Thermal standby happens when the device's temperature goes above safe operating limits. The device reduces performance to cool down, which degrades the experience.
- Thermal shutdown protects the device from overheating by turning it off, which ends the Lens at once.
A higher starting temperature leaves your Lens less budget, for example after an over-budget Lens ran, or in a warm room. Other factors that affect performance:
- The device's temperature from earlier use
- The ambient temperature
- How the Lens is used (for example, in low light)
- Other power-intensive operations running at the same time
- SLAM, VIO, and mapping. See Environment Setup Guidance.
B shows the battery level, so you can see how your Lens affects battery use and plan testing sessions.
Optimize a Lens with high readings
If your Lens's CPU, GPU, or memory readings trend high, it needs optimizing:
- Make materials and shaders simpler.
- Lower the resolution of high-resolution textures.
- Watch memory use in the Performance HUD.
- Check the frame rate.
- Use fewer polygons in 3D models.
- Optimize script performance.
Related
- SPECS Monitor: graph power and temperature in Lens Studio, and record Perfetto traces.
- Optimizing Lens Performance: techniques and tips.
- Publishing Your Lens: the developer checklist for Lens Explorer.